Array Displays
Like CameraDisplays, ctapipe provides a way to display information related to the array on the ground: ArrayDisplay
[1]:
from ctapipe.visualization import ArrayDisplay
from ctapipe.instrument import SubarrayDescription
from ctapipe.coordinates import GroundFrame, EastingNorthingFrame
from ctapipe.containers import HillasParametersContainer

from astropy.coordinates import SkyCoord
from astropy import units as u

import matplotlib.pyplot as plt
import numpy as np

plt.rcParams["figure.figsize"] = (8, 6)
[2]:
tel_ids = list(range(1, 5)) + list(range(5, 20))  # just LSTs  + one set of MSTs

subarray = SubarrayDescription.read(
    "dataset://gamma_20deg_0deg_run1___cta-prod5-lapalma_desert-2158m-LaPalma-dark_100evts.simtel.zst"
).select_subarray(tel_ids)
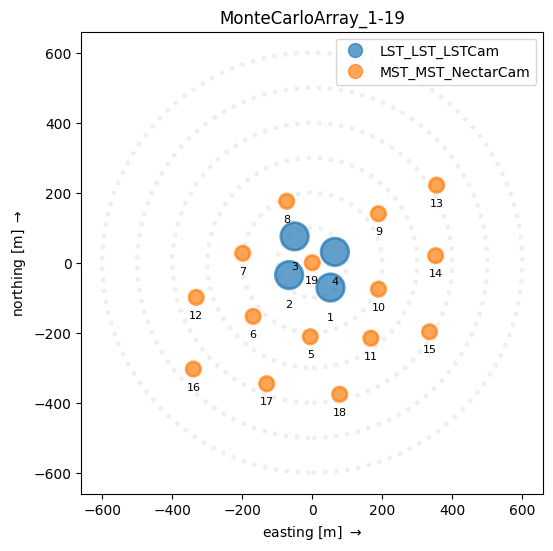
An array display is created for example in subarray.peek():
[3]:
subarray.peek()
However, you can make one manually with a bit more flexibility:
Constructing an ArrayDisplay
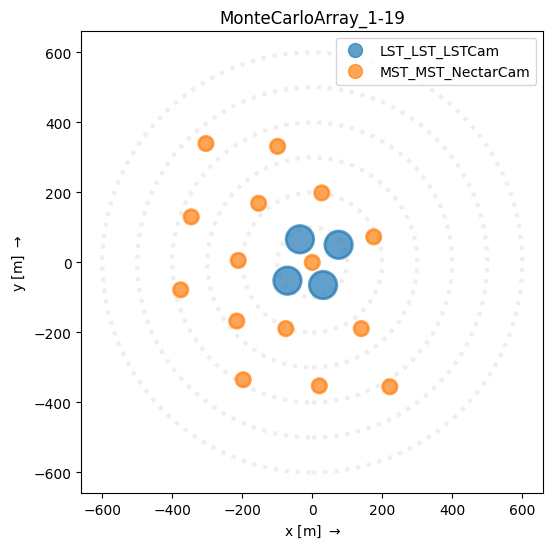
[4]:
disp = ArrayDisplay(subarray)
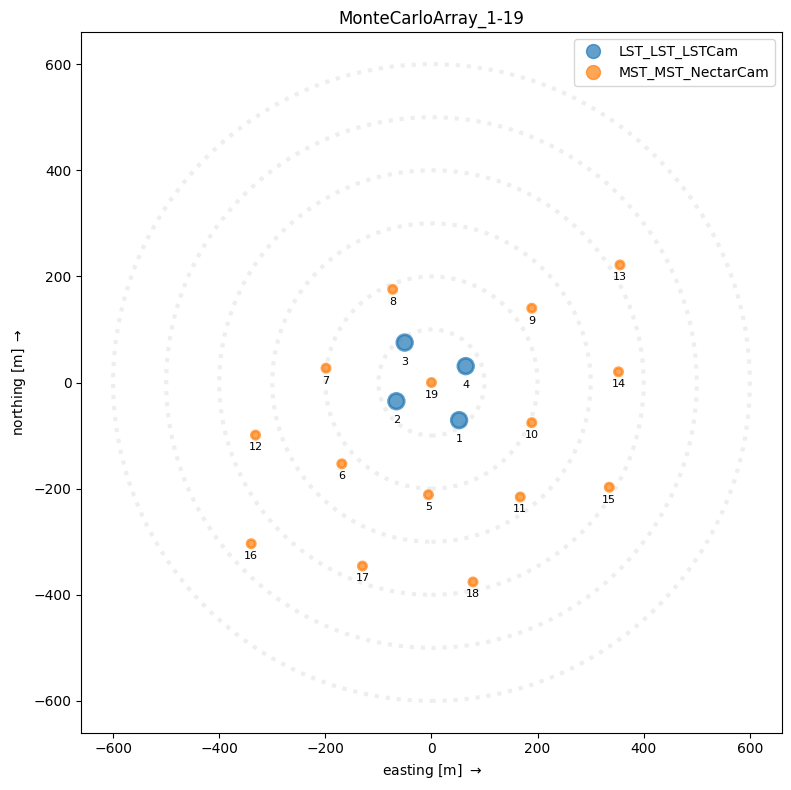
You can specify the Frame you want as long as it is compatible with GroundFrame. EastingNorthingFrame is probably the most useful. You can also add telescope labels
[5]:
disp = ArrayDisplay(subarray, frame=EastingNorthingFrame())
disp.add_labels()
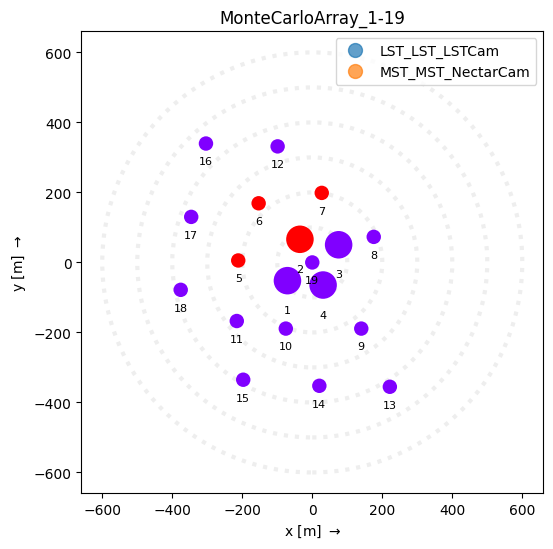
Using color to show information
By default the color of the telescope circles correlates to telescope type. However, you can use color to convey other information by setting the values attribute, like a trigger pattern
[6]:
plt.set_cmap("rainbow")  # the array display will use the current colormap for values

ad = ArrayDisplay(subarray)
ad.telescopes.set_linewidth(0)  # to turn off the telescope borders

trigger_pattern = np.zeros(subarray.n_tels)
trigger_pattern[
    [
        1,
        4,
        5,
        6,
    ]
] = 1
ad.values = trigger_pattern  # display certain telescopes in a color
ad.add_labels()
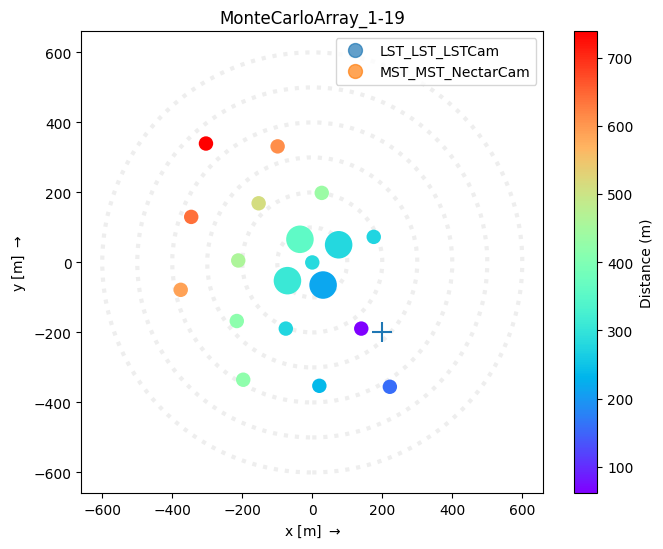
or for example, you could use color to represent the telescope distance to the impact point
[7]:
shower_impact = SkyCoord(200 * u.m, -200 * u.m, 0 * u.m, frame=EastingNorthingFrame())
[8]:
plt.set_cmap("rainbow")  # the array display will use the current colormap for values
ad = ArrayDisplay(subarray)
ad.telescopes.set_linewidth(0)  # to turn off the telescope borders
plt.scatter(shower_impact.easting, shower_impact.northing, marker="+", s=200)

distances = np.hypot(
    subarray.tel_coords.cartesian.x - shower_impact.cartesian.x,
    subarray.tel_coords.cartesian.y - shower_impact.cartesian.y,
)
ad.values = distances
plt.colorbar(ad.telescopes, label="Distance (m)")
[8]:
<matplotlib.colorbar.Colorbar at 0x7fe5d5d39fd0>
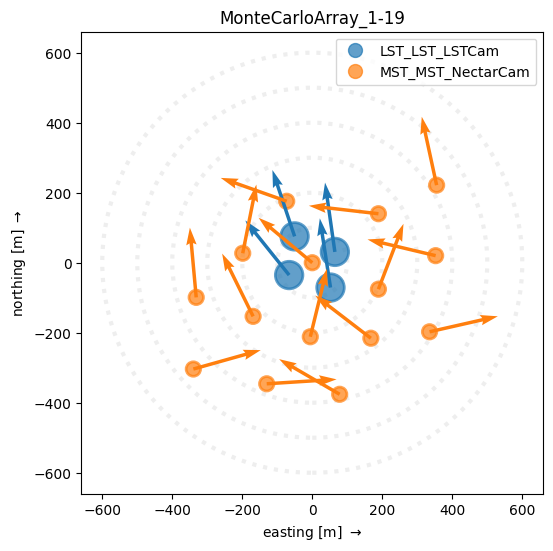
Overlaying vectors
For plotting reconstruction quantities, it’s useful to overlay vectors on the telescope positions. ArrayDisplay provides functions: * set_vector_uv to set by cartesian coordinates from the center of each telescope * set_vector_rho_phi to set by polar coorinates from the center of each telescope * set_vector_hillas to set vectors from a dict[int,HillasParameters] mapping tel_id (not index!) to a set of parameters.
[9]:
np.random.seed(0)
phis = np.random.uniform(0, 180.0, size=subarray.n_tels) * u.deg
rhos = np.ones(subarray.n_tels) * 200 * u.m


ad = ArrayDisplay(subarray, frame=EastingNorthingFrame(), tel_scale=2)
ad.set_vector_rho_phi(rho=rhos, phi=phis)
Overlaying Image Axes
For the common use case of plotting image axis on an ArrayDisplay, the set_line_hillas() method is provided for convenience. The following example shows its use:
[10]:
import matplotlib.pyplot as plt
from astropy.coordinates import SkyCoord
from ctapipe.calib import CameraCalibrator
from ctapipe.image import ImageProcessor
from ctapipe.io import EventSource
from ctapipe.reco import ShowerProcessor
from ctapipe.utils import get_dataset_path
from ctapipe.visualization import ArrayDisplay
from IPython import display
from matplotlib.animation import FuncAnimation

input_url = "dataset://gamma_LaPalma_baseline_20Zd_180Az_prod3b_test.simtel.gz"
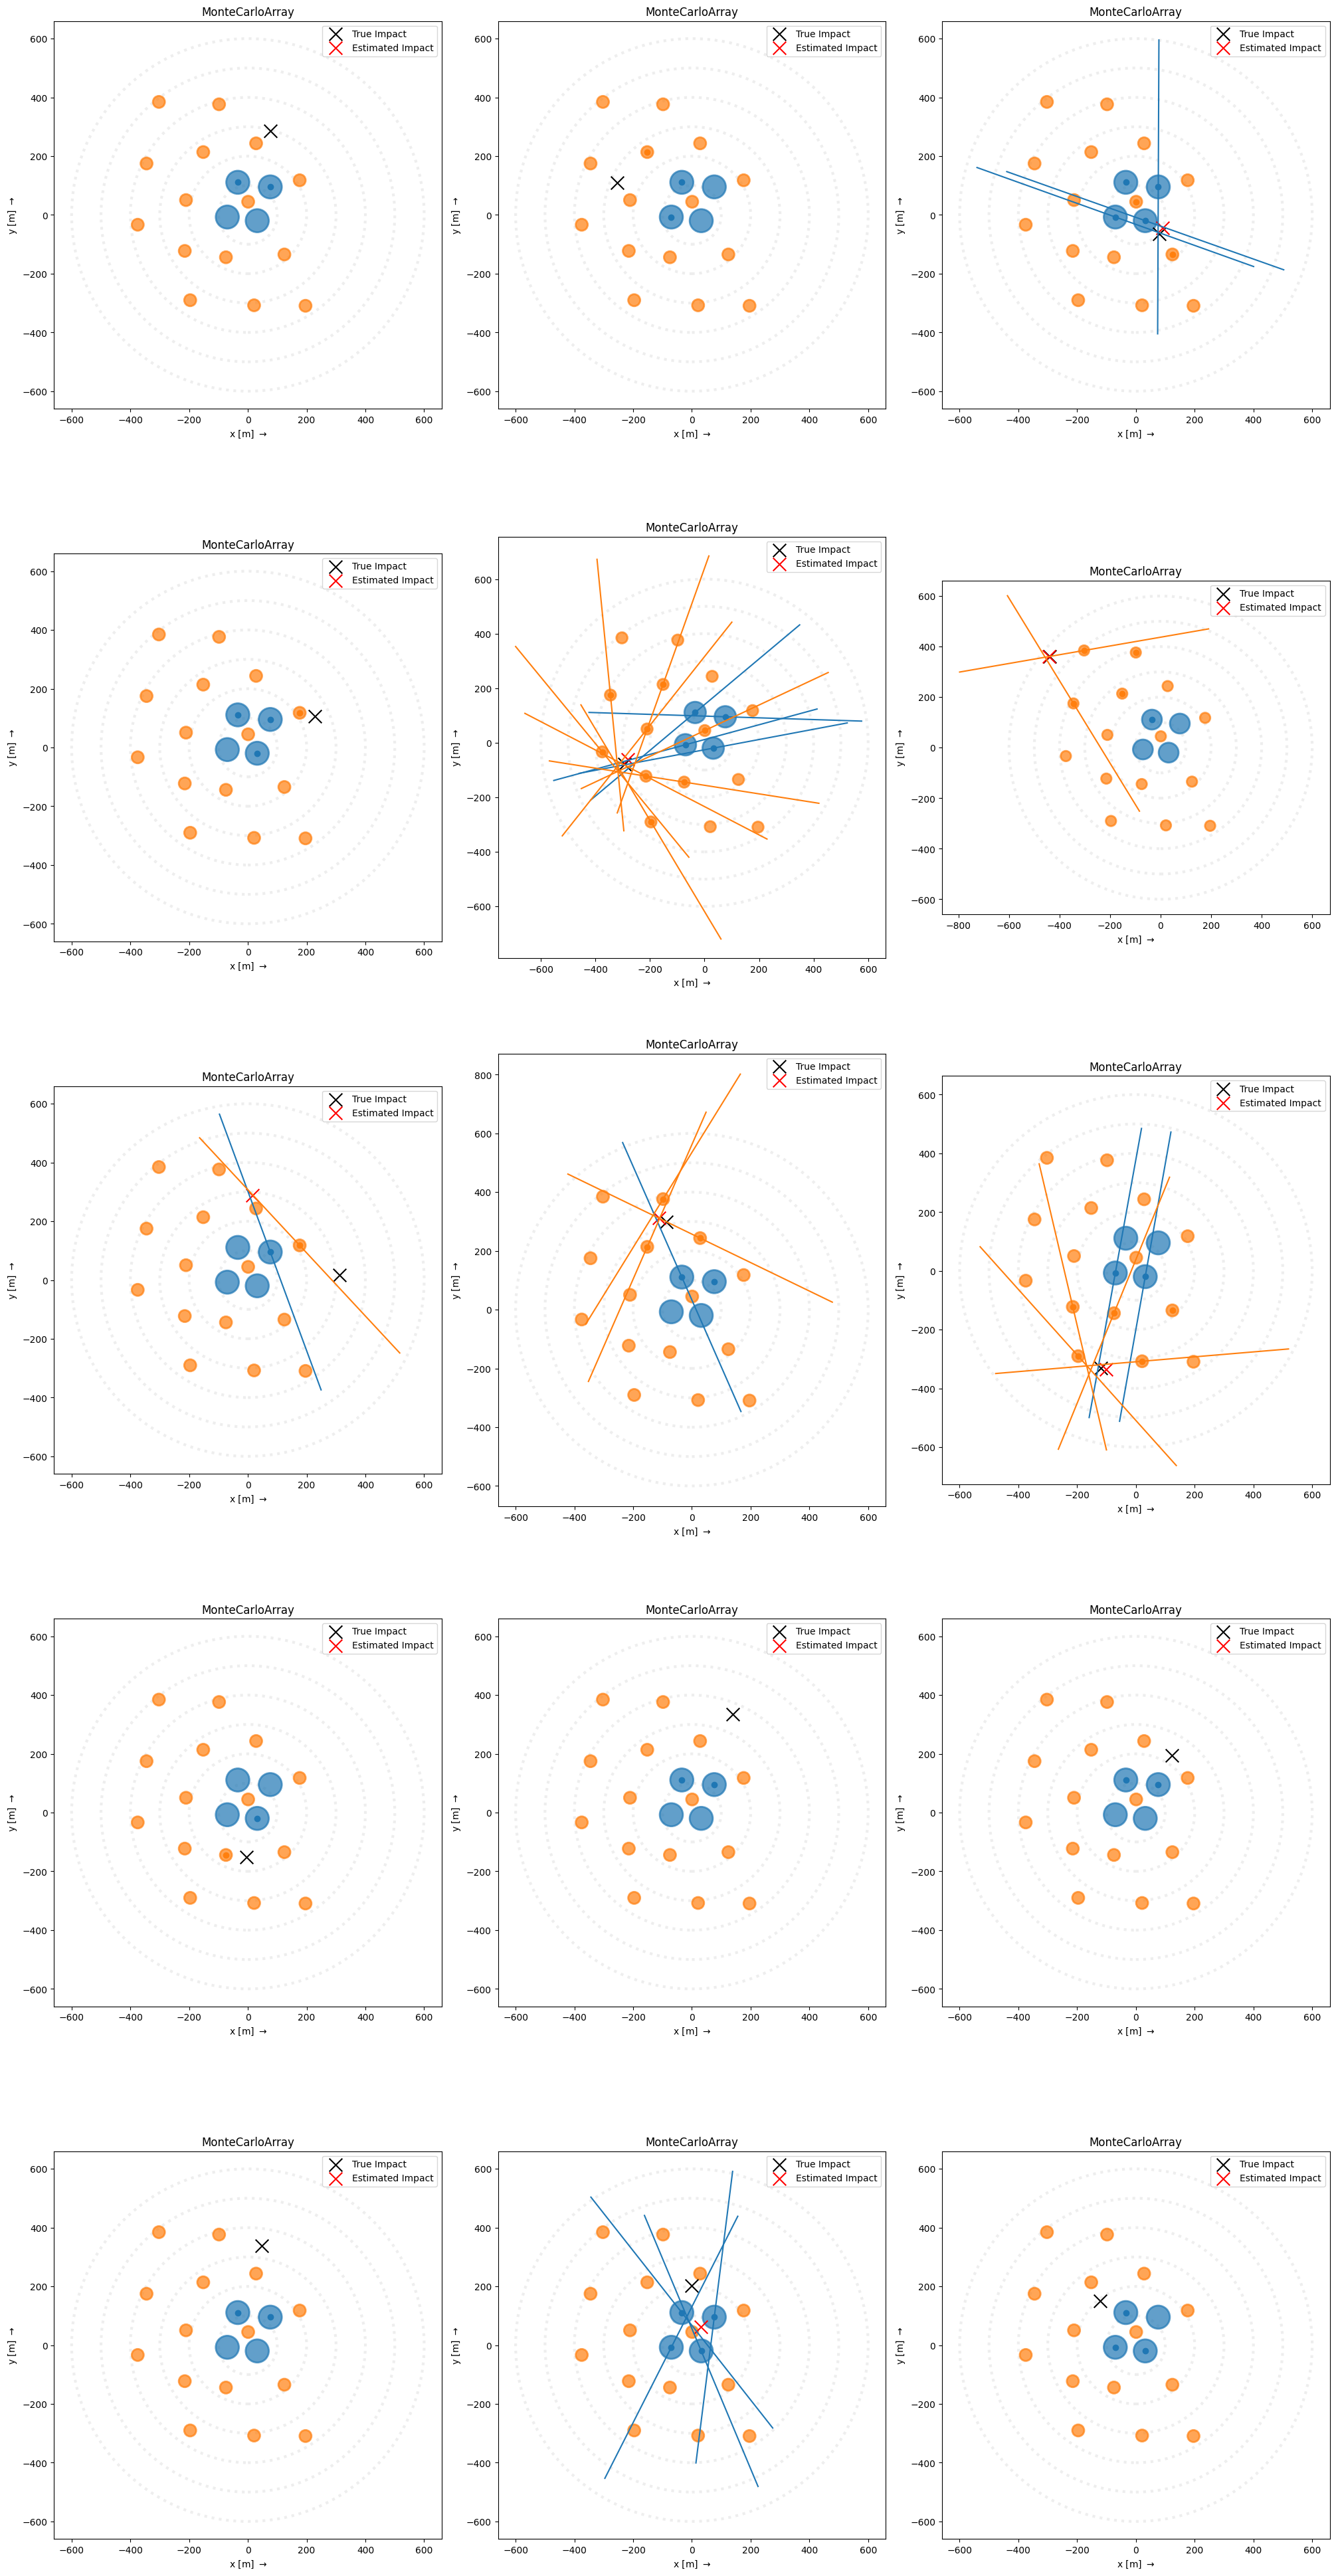
First, we define a function to plot the array with overlaid lines for the image axes
[11]:
def plot_event(event, subarray, ax):
    """
    Draw an ArrayDisplay with image axes and the
    true and reconstructed impact position overlaid
    """

    array_pointing = SkyCoord(
        az=event.pointing.array_azimuth,
        alt=event.pointing.array_altitude,
        frame="altaz",
    )

    angle_offset = event.pointing.array_azimuth
    disp = ArrayDisplay(subarray, axes=ax)

    hillas_dict = {tid: tel.parameters.hillas for tid, tel in event.dl1.tel.items()}
    core_dict = {tid: tel.parameters.core.psi for tid, tel in event.dl1.tel.items()}

    disp.set_line_hillas(
        hillas_dict,
        core_dict,
        500,
    )

    reco_shower = event.dl2.stereo.geometry["HillasReconstructor"]

    ax.scatter(
        event.simulation.shower.core_x,
        event.simulation.shower.core_y,
        s=200,
        c="k",
        marker="x",
        label="True Impact",
    )
    ax.scatter(
        reco_shower.core_x,
        reco_shower.core_y,
        s=200,
        c="r",
        marker="x",
        label="Estimated Impact",
    )

    ax.legend()
Now, we can loop through some events and plot them. Here we apply default calibration, image processing, and reconstruction, however it is better to use ctapipe-process with a well-defined configuration to do this in reality. Note that some events will not have images bright enough to do parameterization or reconstruction, so they will have no image axis lines or no estimated impact position.
[12]:
fig, ax = plt.subplots(5, 3, figsize=(20, 40), constrained_layout=True)
ax = ax.ravel()

with EventSource(input_url, max_events=15, focal_length_choice="EQUIVALENT") as source:
    calib = CameraCalibrator(subarray=source.subarray)
    process_images = ImageProcessor(subarray=source.subarray)
    process_shower = ShowerProcessor(subarray=source.subarray)

    for i, event in enumerate(source):
        calib(event)
        process_images(event)
        process_shower(event)
        plot_event(event, source.subarray, ax=ax[i])